Multiple Choice
Consider the following bar graph. How many barrels of per day were used by Germany? 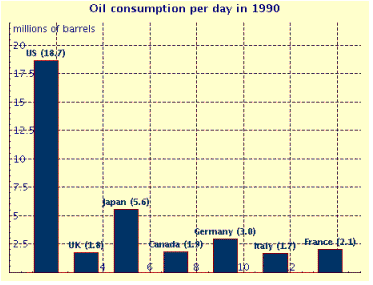
A) 25.6 million barrels
B) 2.1 million barrels
C) 0.2718 million barrels
D) 1.8 million barrels
E) 2.72 million barrels
Correct Answer:

Verified
Correct Answer:
Verified
Related Questions
Q142: Use the figure below to answer the
Q143: <img src="https://d2lvgg3v3hfg70.cloudfront.net/TBX8813/.jpg" alt=" A hygrothermograph is
Q144: A trucking company had hauls of
Q145: Find the median measurement for the
Q146: Find the sample standard deviation from
Q148: A card is chosen from a
Q149: Find the sample standard deviation from
Q150: Draw a circle graph. Depict the
Q151: A survey of 100 families was
Q152: Consider the following bar graph. What country