Multiple Choice
An industrial technician must keep a chemical at a temperature below 60° F. He must also keep an hourly record of its temperature and record each day's temperature on a line graph. The following table shows the data he collected. Draw a line graph for these data.
A) 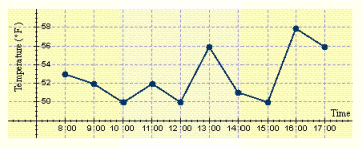
B) 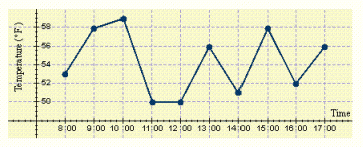
C) 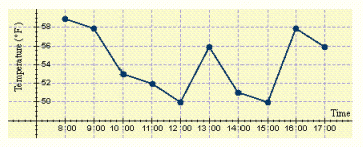
D) 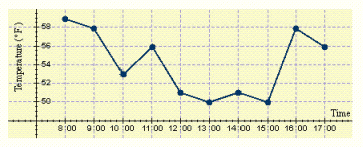
E) 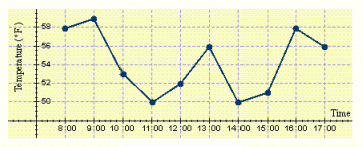
Correct Answer:

Verified
Correct Answer:
Verified
Related Questions
Q21: x is paired with y by
Q22: x is paired with y by
Q23: The highest level of education for
Q24: Find the mean measurement for the
Q25: Four dice are rolled. What is
Q27: Consider the following bar graph. How many
Q28: Find 18.2% of 360<sup>o</sup> Round your answer
Q29: The sample space is the pieces
Q30: The table below gives the average
Q31: Find the mean measurement for the set