Multiple Choice
The highest level of education for persons age 25 and older in some state in 2004 can be found in the data below. Draw a circle graph.
A) 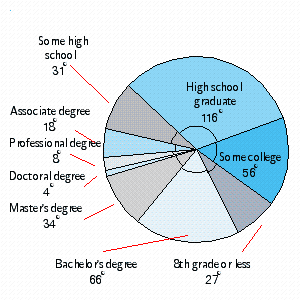
B) 
C) 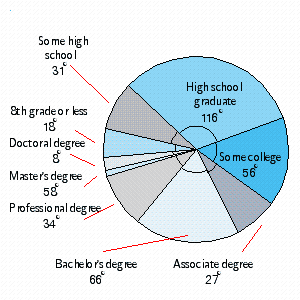
D) 
E) 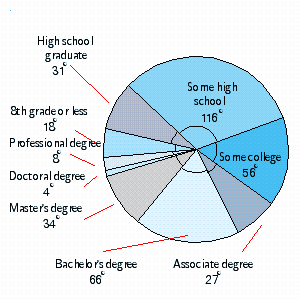
Correct Answer:

Verified
Correct Answer:
Verified
Related Questions
Q18: The depth of a silicon wafer
Q19: Find the median measurement for the
Q20: The following list gives 50 pieces
Q21: x is paired with y by
Q22: x is paired with y by
Q24: Find the mean measurement for the
Q25: Four dice are rolled. What is
Q26: An industrial technician must keep a
Q27: Consider the following bar graph. How many
Q28: Find 18.2% of 360<sup>o</sup> Round your answer