Multiple Choice
The life expectancy of a fluorescent light bulb is given by the number of hours that it will burn, tabulated in the frequency distribution in the table below. Draw a histogram for the data displayed.
A) 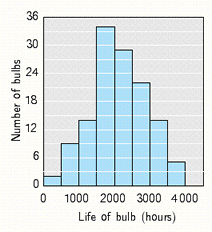
B) 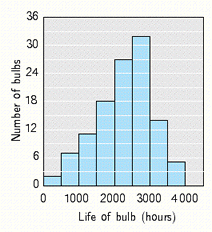
C) 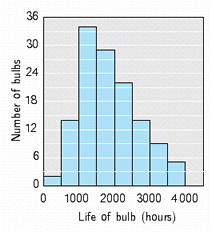
D) 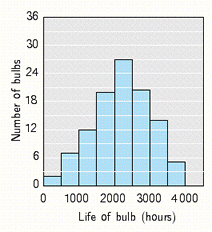
E) 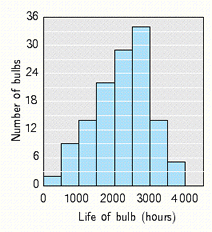
Correct Answer:

Verified
Correct Answer:
Verified
Related Questions
Q151: A survey of 100 families was
Q152: Consider the following bar graph. What country
Q153: The sample space is the set
Q154: Find 31% of 360<sup>o</sup> Round your answer
Q155: Find the sample standard deviation from
Q157: From the following grouped data, find
Q158: A card is chosen from a
Q159: A bag contains 10 green marbles,
Q160: An inspector recorded the number of
Q161: The shipment times in hours for