Multiple Choice
A survey of 100 families was taken to find the number of times the families had gone out to eat in the past month. The data are given in the table below. Draw a bar graph for this survey.
A) 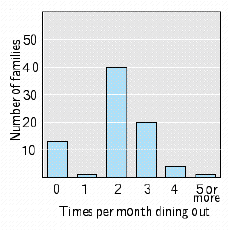
B) 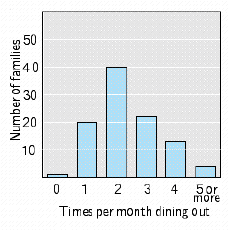
C) 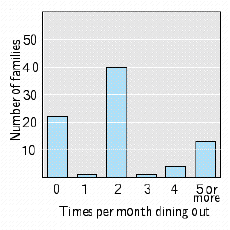
D) 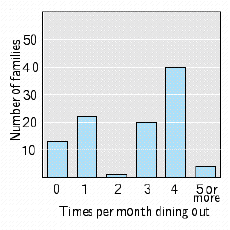
E) 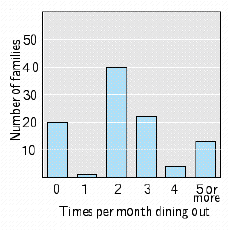
Correct Answer:

Verified
Correct Answer:
Verified
Related Questions
Q146: Find the sample standard deviation from
Q147: Consider the following bar graph. How many
Q148: A card is chosen from a
Q149: Find the sample standard deviation from
Q150: Draw a circle graph. Depict the
Q152: Consider the following bar graph. What country
Q153: The sample space is the set
Q154: Find 31% of 360<sup>o</sup> Round your answer
Q155: Find the sample standard deviation from
Q156: The life expectancy of a fluorescent