Multiple Choice
The table below lists the male life expectancy for the given countries. Draw a bar graph for these data.
A) 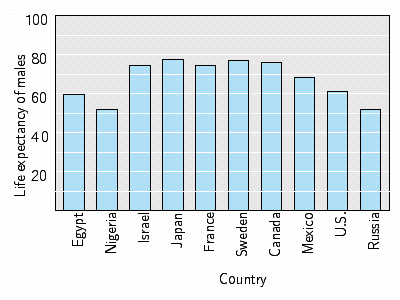
B) 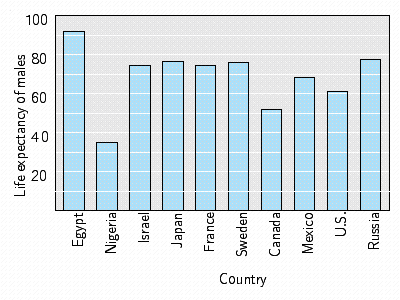
C) 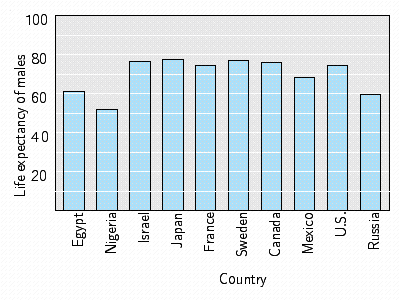
D) 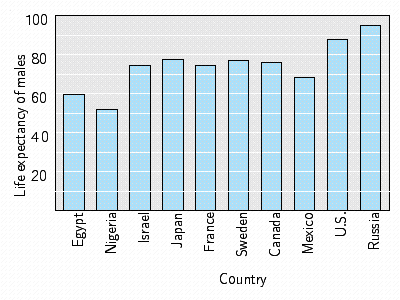
E) 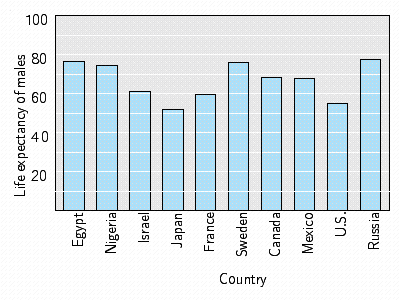
Correct Answer:

Verified
Correct Answer:
Verified
Related Questions
Q47: Draw a circle graph. In 1996, the
Q48: Find 65% of 360<sup>o</sup><br>A) 306<sup>o</sup><br>B) 270<sup>o</sup><br>C) 234<sup>o</sup><br>D)
Q49: The sample space is the set
Q50: Find the sample standard deviation from
Q51: In a classroom there are 13
Q53: <img src="https://d2lvgg3v3hfg70.cloudfront.net/TBX8813/.jpg" alt=" A hygrothermograph is
Q54: The sample space is the set
Q55: A laboratory technician records the life
Q56: A trucking company had seven items
Q57: Find the median measurement for the