Multiple Choice
Draw a circle graph. In 1996, the values, in millions of dollars, of crop output for farms in the United States were as follows: food grains, 11,666
Food crops, 20,065
Cotton, 7,342
Oil crops, 17,703
Tobacco, 4,900
Fruits and tree nuts, 11,593
Vegetables, 14,491
All other, 15,737
A) 
B) 
C) 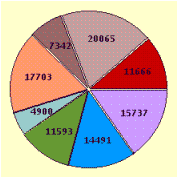
D) 
Correct Answer:

Verified
Correct Answer:
Verified
Q42: Find the sample standard deviation from
Q43: A certain manufacturing process has a
Q44: Find the sample space of the diamonds
Q45: Consider the following bar graph. How many
Q46: A coin is tossed, and a
Q48: Find 65% of 360<sup>o</sup><br>A) 306<sup>o</sup><br>B) 270<sup>o</sup><br>C) 234<sup>o</sup><br>D)
Q49: The sample space is the set
Q50: Find the sample standard deviation from
Q51: In a classroom there are 13
Q52: The table below lists the male