menu-iconExamlexExamLexServices

Discover

Ask a Question
  1. All Topics
  2. Topic
    Mathematics
  3. Study Set
    Elementary Technical Mathematics
  4. Exam
    Exam 15: Basic Statistics
  5. Question
    Consider the Following Bar Graph
Solved

Consider the Following Bar Graph

Question 183

Question 183

Short Answer

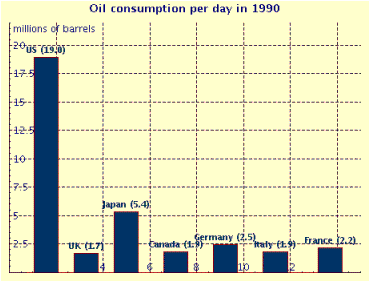
Consider the following bar graph. How many barrels of oil per day were used by Italy? Consider the following bar graph. How many barrels of oil per day were used by Italy?   __________ million barrels __________ million barrels
Correct Answer:

verifed

Verified

Unlock this answer now
Get Access to more Verified Answers free of charge

Related Questions

Q178: Use the frequency distribution to find

Q179: Given the 20 numbers 31, 35, 36,

Q180: Find the median measurement for the

Q181: Consider the following bar graph. What country

Q182: A trucking company had 7 items with

Q184: A technician measured the power usage

Q185: Find the sample space of marbles taken

Q186: Find the sample standard deviation from

Q187: Find the sample space of pieces of

Q188: Use the frequency distribution to find

Examlex

ExamLex

About UsContact UsPerks CenterHomeschoolingTest Prep

Work With Us

Campus RepresentativeInfluencers

Links

FaqPricingChrome Extension

Download The App

Get App StoreGet Google Play

Policies

Privacy PolicyTerms of ServiceHonor CodeCommunity Guidelines

Scan To Download

qr-code

Copyright © (2025) ExamLex LLC.

Privacy PolicyTerms Of ServiceHonor CodeCommunity Guidelines