Multiple Choice
The depth of a silicon wafer is targeted at 1.015 mm. If properly functioning, the process produces items with a mean of 1.015 mm and a standard deviation of ±0.004 A sample of 16 items is measured once each hour. The sample means for the past 12 hours are given in the table below. From the table of data, determine the most accurate mean control chart.
A) 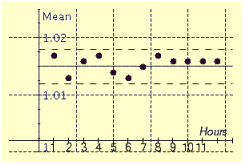
B) 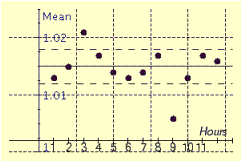
C) 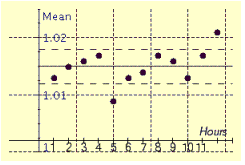
D) 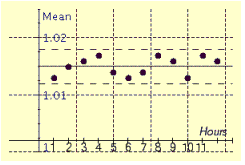
Correct Answer:

Verified
Correct Answer:
Verified
Q13: Find the mean measurement for the set
Q14: Of 1,859 students, 210 are taking technical
Q15: Mindy's basketball coach kept records on each
Q16: Find the sample standard deviation from
Q17: A laboratory technician records the life
Q19: Find the median measurement for the
Q20: The following list gives 50 pieces
Q21: x is paired with y by
Q22: x is paired with y by
Q23: The highest level of education for