Multiple Choice
Which one of the following represents the graph of  ?
?
A) 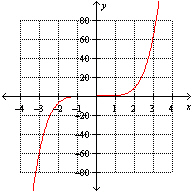
B) 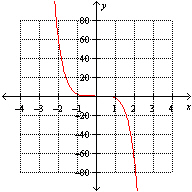
C) 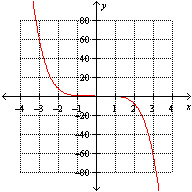
D) 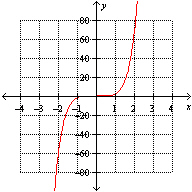
E) None of the above
Correct Answer:

Verified
Correct Answer:
Verified
Q321: If the sales tax rate is 6%
Q322: Round <img src="https://d2lvgg3v3hfg70.cloudfront.net/TBX8673/.jpg" alt="Round to
Q323: Use the table given to pick the
Q324: Simplify the expression <img src="https://d2lvgg3v3hfg70.cloudfront.net/TBX8673/.jpg" alt="Simplify the
Q325: Divide the decimals. <img src="https://d2lvgg3v3hfg70.cloudfront.net/TBX8673/.jpg" alt="Divide the
Q327: Round <img src="https://d2lvgg3v3hfg70.cloudfront.net/TBX8673/.jpg" alt="Round to
Q328: The following gives U.S. unemployment rates for
Q329: Every fraction may be written as a
Q330: Multiply or divide as indicated without a
Q331: A ball is thrown straight upward from