Multiple Choice
A population of rabbits was tracked over a 55-day period. The data is shown in the following graph. What was the maximum number of rabbits during this time period? 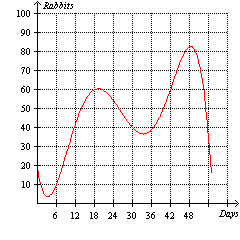
A) 61
B) 49
C) 38
D) 15
E) 83
Correct Answer:

Verified
Correct Answer:
Verified
Q221: Find the unit price for a 64-ounce
Q222: The table below shows the salary values
Q223: Convert the number 0.7575 to a fraction
Q224: Subtract the fractions. Reduce to simplest form.
Q225: Find the absolute value of the expression.
Q227: Convert a variable number of square yards
Q228: Given the table below is the variable
Q229: Multiply the decimals. <img src="https://d2lvgg3v3hfg70.cloudfront.net/TBX8673/.jpg" alt="Multiply the
Q230: Find <img src="https://d2lvgg3v3hfg70.cloudfront.net/TBX8673/.jpg" alt="Find of
Q231: Calculate the value of <img src="https://d2lvgg3v3hfg70.cloudfront.net/TBX8673/.jpg" alt="Calculate