Multiple Choice
The owner of a gas station records the number of gallons of gas he sells over a period of time. He notices that the number of gallons of gas he sells depends linearly on the price he charges for each gallon. When he charges $1.96 per gallon of gas he sells 800 gallons of gas each day. When he charges $2.65 per gallon he sells 400 gallons. Which one of the following graphs illustrate this situation?
A) None of these options
B) 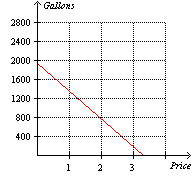
C) 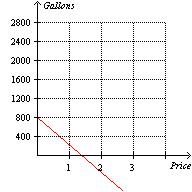
D) 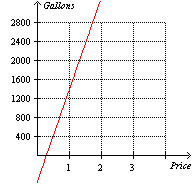
E) 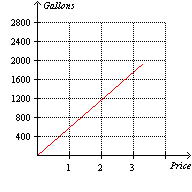
Correct Answer:

Verified
Correct Answer:
Verified
Q52: Using the following table of values determine
Q53: The solution to the equation <img src="https://d2lvgg3v3hfg70.cloudfront.net/TBX8673/.jpg"
Q54: Is <img src="https://d2lvgg3v3hfg70.cloudfront.net/TBX8673/.jpg" alt="Is an
Q55: Given the solution set drawn on the
Q56: Which one of the following equations has
Q58: Using the function <img src="https://d2lvgg3v3hfg70.cloudfront.net/TBX8673/.jpg" alt="Using the
Q59: When both sides of an inequality are
Q60: Given the solution set drawn on the
Q61: A beanstalk grows at a constant rate.
Q62: The solution to the equation <img src="https://d2lvgg3v3hfg70.cloudfront.net/TBX8673/.jpg"