Multiple Choice
A beanstalk grows at a constant rate. The beanstalk s height (inches) as a function of time (days) is modeled by  . Which of the following graphs illustrate the function h ?
A) 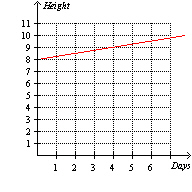
B) 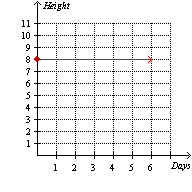
C) 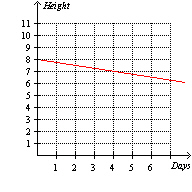
D) 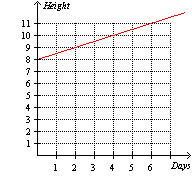
E) None of these options
Correct Answer:

Verified
Correct Answer:
Verified
Q56: Which one of the following equations has
Q57: The owner of a gas station records
Q58: Using the function <img src="https://d2lvgg3v3hfg70.cloudfront.net/TBX8673/.jpg" alt="Using the
Q59: When both sides of an inequality are
Q60: Given the solution set drawn on the
Q62: The solution to the equation <img src="https://d2lvgg3v3hfg70.cloudfront.net/TBX8673/.jpg"
Q63: The solution to the equation <img src="https://d2lvgg3v3hfg70.cloudfront.net/TBX8673/.jpg"
Q64: The following table shows the swim times
Q65: For any value of x <img src="https://d2lvgg3v3hfg70.cloudfront.net/TBX8673/.jpg"
Q66: A speed camera records the distance that