Multiple Choice
The following table shows the swim times s for a certain swimmer for the 400-meter freestyle swims during the years 2001 to 2007. Let represent the year 2001. 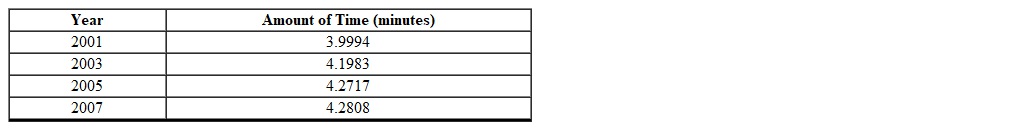 Which one of the following equations is the line of best fit for the data provided? (Rounded to the nearest ten-thousandths)
A) 
B) 
C) 
D) 
E) 
Correct Answer:

Verified
Correct Answer:
Verified
Q59: When both sides of an inequality are
Q60: Given the solution set drawn on the
Q61: A beanstalk grows at a constant rate.
Q62: The solution to the equation <img src="https://d2lvgg3v3hfg70.cloudfront.net/TBX8673/.jpg"
Q63: The solution to the equation <img src="https://d2lvgg3v3hfg70.cloudfront.net/TBX8673/.jpg"
Q65: For any value of x <img src="https://d2lvgg3v3hfg70.cloudfront.net/TBX8673/.jpg"
Q66: A speed camera records the distance that
Q67: A ball is thrown straight upward from
Q68: The solution to the equation <img src="https://d2lvgg3v3hfg70.cloudfront.net/TBX8673/.jpg"
Q69: A linear equation always has one solution.