Multiple Choice
The model 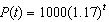 describes the amount of bacteria in a Petri dish after t hours. Which one of the following written statements best describes this population?
A) The amount of bacteria decreases by 17% each hour.
B) The amount of bacteria increases by 117% each hour.
C) The amount of bacteria decreases by 117% each hour.
D) The amount of bacteria increases by 17% each hour.
E) The amount of bacteria increases by 1.17% each hour.
Correct Answer:

Verified
Correct Answer:
Verified
Q50: Use the graph to find the x-
Q51: The function <img src="https://d2lvgg3v3hfg70.cloudfront.net/TBX8673/.jpg" alt="The function
Q52: Determine whether the graph represents a function.
Q53: When you graph a set of points
Q54: Decide whether you would graph the equation
Q56: Using the following table of a function
Q57: Determine whether the following relation is a
Q58: Use the graph to find the equation
Q59: In 1990 a town's population was 21354.
Q60: Evaluate the function. <img src="https://d2lvgg3v3hfg70.cloudfront.net/TBX8673/.jpg" alt="Evaluate the