Multiple Choice
Using the following table of a function that models exponential decay determine which one of the following models the amount of radioactive substance as a function of time? 
A) 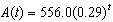
B) 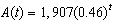
C) 
D) 
E) 
Correct Answer:

Verified
Correct Answer:
Verified
Q51: The function <img src="https://d2lvgg3v3hfg70.cloudfront.net/TBX8673/.jpg" alt="The function
Q52: Determine whether the graph represents a function.
Q53: When you graph a set of points
Q54: Decide whether you would graph the equation
Q55: The model <img src="https://d2lvgg3v3hfg70.cloudfront.net/TBX8673/.jpg" alt="The model
Q57: Determine whether the following relation is a
Q58: Use the graph to find the equation
Q59: In 1990 a town's population was 21354.
Q60: Evaluate the function. <img src="https://d2lvgg3v3hfg70.cloudfront.net/TBX8673/.jpg" alt="Evaluate the
Q61: For the given input-output table complete the