Multiple Choice
During the years 1994 to 2007 seat belt use among front seat passengers ages 16 to 24 has increased. A linear model for the percentage of these passengers who use a seat belt is 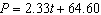 where P is percentage with a seat belt and t is years since 2000. The years before 2000 have a negative value for t. Use the model to predict the percentage of these passengers who used a seat belt in 1998.
A) 59.9%
B) 69.3%
C) 47.2%
Correct Answer:

Verified
Correct Answer:
Verified
Q21: During the years 1994 to 2007 seat
Q22: The _ for a linear data set
Q23: During the years 2002 to 2008 smoking
Q24: Does the data graphed follow a linear
Q25: Decide which line fits the data best.<br>A)
Q27: During the years 2002 to 2008 smoking
Q28: The percentage of eighth grade students P
Q29: You have moved to Chicago in the
Q30: The graph shows the average monthly high
Q31: The percentage of eighth grade students P