Short Answer
You have moved to Chicago in the fall. The graph shows the average monthly high temperature for months since you moved to Chicago. Does the graph show a linear pattern a quadratic pattern or neither? 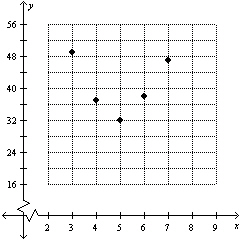
Correct Answer:

Verified
Correct Answer:
Verified
Related Questions
Q24: Does the data graphed follow a linear
Q25: Decide which line fits the data best.<br>A)
Q26: During the years 1994 to 2007 seat
Q27: During the years 2002 to 2008 smoking
Q28: The percentage of eighth grade students P
Q30: The graph shows the average monthly high
Q31: The percentage of eighth grade students P
Q32: A quadratic model for the median price
Q33: The graph shows the average monthly high
Q34: During the years 1994 to 2007 seat