Short Answer
You have moved to Chicago in the fall. The graph shows the average monthly high temperature for months since you moved to Chicago. A quadratic model for this data is 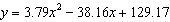 where y is the average monthly high temperature and x is months after you moved to Chicago. Use the model to predict the average monthly high temperature 8 months after you moved to Chicago. Round to one decimal place.
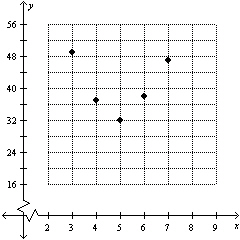
Correct Answer:

Verified
Correct Answer:
Verified
Q51: The Supplemental Nutrition Assistance Program (SNAP) to
Q52: A quadratic model for the median home
Q53: A quadratic model for the median price
Q54: Given a quadratic model <img src="https://d2lvgg3v3hfg70.cloudfront.net/TBX8673/.jpg" alt="Given
Q55: The percentage of eighth grade students P
Q57: Given the data set draw a scatterplot.
Q58: The population of Florida is given in
Q59: During the years 1994 to 2007 seat
Q60: If the prediction of the output value
Q61: Given the data set choose its scatterplot.