Multiple Choice
During the years 1994 to 2007 seat belt use among front seat passengers ages 16 to 24 has increased. A linear model for the percentage of these passengers who use a seat belt is 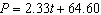 where P is percentage with a seat belt and t is years since 2000. The years before 2000 have a negative value for t. Use the model to predict the percentage of these passengers who used a seat belt in 2017.
A) 10.4%
B) 100%
C) 104.2%
Correct Answer:

Verified
Correct Answer:
Verified
Q54: Given a quadratic model <img src="https://d2lvgg3v3hfg70.cloudfront.net/TBX8673/.jpg" alt="Given
Q55: The percentage of eighth grade students P
Q56: You have moved to Chicago in the
Q57: Given the data set draw a scatterplot.
Q58: The population of Florida is given in
Q60: If the prediction of the output value
Q61: Given the data set choose its scatterplot.
Q62: Decide which line fits the data best.<br>A)
Q63: You are given a quadratic model <img
Q64: Given the data set draw a scatterplot.