Multiple Choice
Use the following graph to create an algebra model for the function. 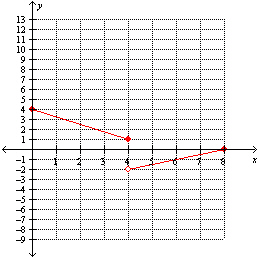
A) 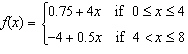
B) 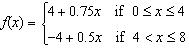
C) 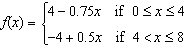
D) 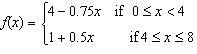
E) 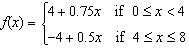
Correct Answer:

Verified
Correct Answer:
Verified
Related Questions
Q19: Find the input(s) corresponding to the output
Q21: For the function <img src="https://d2lvgg3v3hfg70.cloudfront.net/TBX8728/.jpg" alt="For the
Q22: The table below describes the average temperatures
Q23: The following table shows data for the
Q25: Given the table below, is the variable
Q26: Which one of the following best describes
Q28: A membership to a local fitness club
Q29: A population of rabbits was tracked over
Q125: If the net change of a function
Q375: All functions are relations.