Multiple Choice
A population of rabbits was tracked over a 55-day period. The data is shown in the following graph. What was the approximate number of rabbits on day 30? 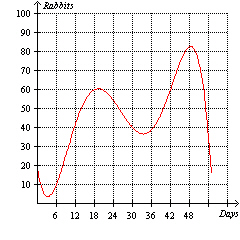
A) 40
B) 15
C) 10
D) 30
E) 83
Correct Answer:

Verified
Correct Answer:
Verified
Related Questions
Q24: Use the following graph to create an
Q25: Given the table below, is the variable
Q26: Which one of the following best describes
Q28: A membership to a local fitness club
Q30: The price per gallon of gas at
Q32: Given the table below, is the variable
Q34: The graphs of <img src="https://d2lvgg3v3hfg70.cloudfront.net/TBX8728/.jpg" alt="The graphs
Q59: All relations are functions.
Q183: If the net change of a function
Q375: All functions are relations.