Multiple Choice
A population of rabbits was tracked over a 55-day period. The data is shown in the following graph. What was the minimum number of rabbits during this time? 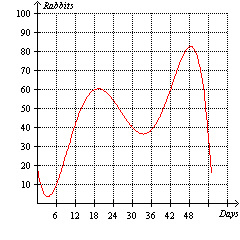
A) 20
B) 37
C) 83
D) 5
E) 15
Correct Answer:

Verified
Correct Answer:
Verified
Related Questions
Q10: The number of gallons of water remaining
Q11: Using the table below, determine the value
Q12: Using the table below, determine the value
Q13: The table below describes the average temperatures
Q15: Which one of the following models the
Q16: The mass of bacteria (in micrograms) in
Q17: The mass of bacteria (in micrograms) in
Q18: The graphs of <img src="https://d2lvgg3v3hfg70.cloudfront.net/TBX8728/.jpg" alt="The graphs
Q19: Find the input(s) corresponding to the output
Q20: Find a function that models the volume