Multiple Choice
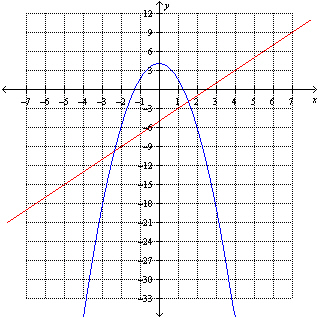
The graphs of  and
and 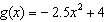 are shown below. Find the value(s) of x for which
  .
. 
A) 
B) 
C) 
D) 
E) 
Correct Answer:

Verified
Correct Answer:
Verified
Related Questions
Q13: The table below describes the average temperatures
Q14: A population of rabbits was tracked over
Q15: Which one of the following models the
Q16: The mass of bacteria (in micrograms) in
Q17: The mass of bacteria (in micrograms) in
Q19: Find the input(s) corresponding to the output
Q21: For the function <img src="https://d2lvgg3v3hfg70.cloudfront.net/TBX8728/.jpg" alt="For the
Q22: The table below describes the average temperatures
Q23: The following table shows data for the
Q125: If the net change of a function