Multiple Choice
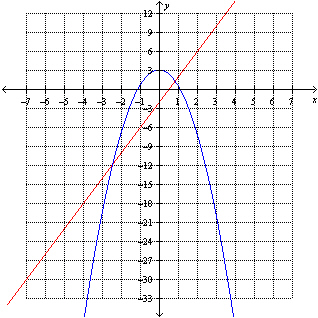
The graphs of  and
and 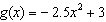 are shown below. Find the value(s) of x for which
  .
. 
A) -2.4 and 0.8
B) 0.8
C) -2.4 and -11.7
D) -2.4
E) -11.7 and 1.3
Correct Answer:

Verified
Correct Answer:
Verified
Related Questions
Q29: A population of rabbits was tracked over
Q30: The price per gallon of gas at
Q32: Given the table below, is the variable
Q35: Does the equation x = ( y
Q36: Which of the following formulas express the
Q37: The table below illustrates a set of
Q38: The distance d (in miles) that a
Q39: For the function <img src="https://d2lvgg3v3hfg70.cloudfront.net/TBX8728/.jpg" alt="For the
Q59: All relations are functions.
Q183: If the net change of a function