Multiple Choice
The owner of a gas station records the number of gallons of gas he sells over a period of time. He notices that the number of gallons of gas he sells depends linearly on the price he charges for each gallon. When he charges $1.96 per gallon of gas, he sells 800 gallons of gas each day. When he charges $2.65 per gallon, he sells 400 gallons. Which one of the following graphs illustrate this situation?
A) None of these options
B) 
C) 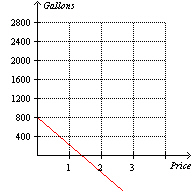
D) 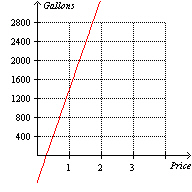
E) 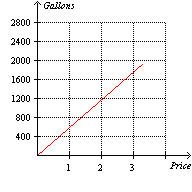
Correct Answer:

Verified
Correct Answer:
Verified
Q48: Using the following graph, determine the average
Q49: Biologists observed that as the temperature t
Q50: If the slope of a line is
Q51: Find the equation of a line that
Q54: Given the graph below, find the rise
Q55: Which one of the following equations has
Q56: Using the following table of values, determine
Q57: Find the equation of the line for
Q58: Using the graph below, determine the point
Q66: A speed camera records the distance that