Multiple Choice
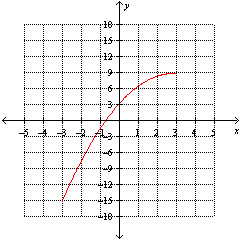
Using the following graph, determine the average rate of change of the function between  and
and  .
. 
A) -15.3
B) 6.0
C) 24.0
D) 4.0
E) 8.7
Correct Answer:

Verified
Correct Answer:
Verified
Related Questions
Q44: The cost of college tuition for 12
Q45: The mass of bacteria (in micrograms) in
Q46: A hotel finds that if it spends
Q49: Biologists observed that as the temperature t
Q50: If the slope of a line is
Q51: Find the equation of a line that
Q53: The owner of a gas station records
Q66: A speed camera records the distance that
Q109: The cost for a cell phone plan
Q133: After taking a bath you begin to