Multiple Choice
The table below shows the breakdown of International Arms Sales per country for a particular year. 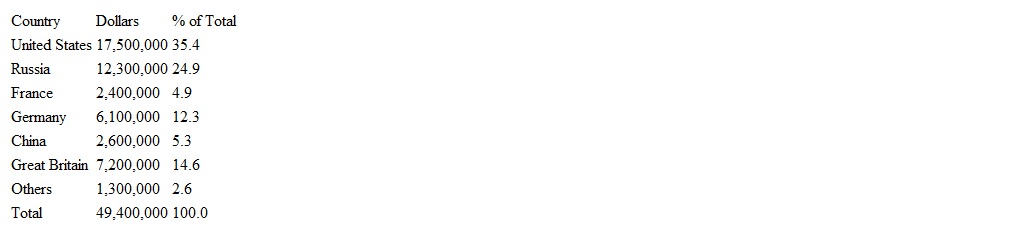 Construct a circle graph using the % of Total data.
A) 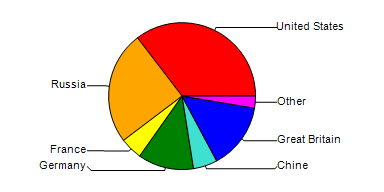
B) 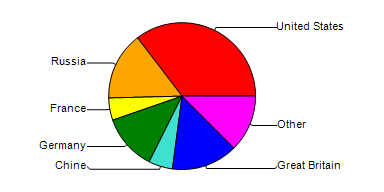
C) 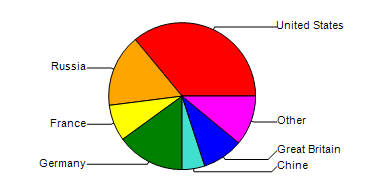
D) 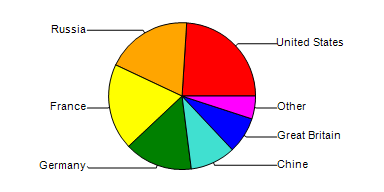
E) 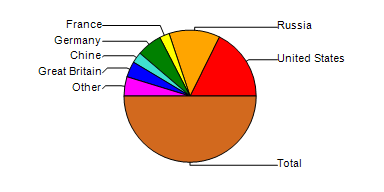
Correct Answer:

Verified
Correct Answer:
Verified
Related Questions
Q39: Wendy took a standardized test that consisted
Q40: If two cards are selected from a
Q41: family of 7 decides that each member
Q42: Drawing from a regular deck of playing
Q43: It costs $2.75 to play a dice
Q45: A bag contains 10 colored beads. A
Q46: Beatrice has a 2.60 GPA after completing
Q47: The table below shows the immigration rates
Q48: Eight health maintenance organizations (HMOs) presented group
Q49: How can <img src="https://d2lvgg3v3hfg70.cloudfront.net/TBX9048/.jpg" alt="How can