Multiple Choice
The table below shows the immigration rates in thousands by decade, from 1900 to 1990, of a small European country.  Construct a line graph to display this data.
A) 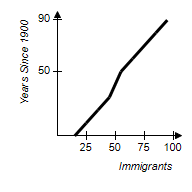
B) 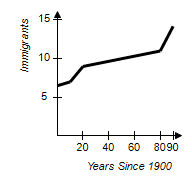
C) 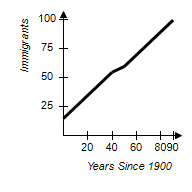
D) 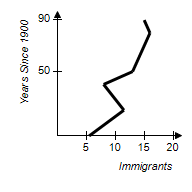
E) 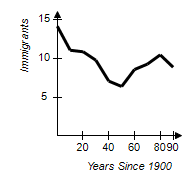
Correct Answer:

Verified
Correct Answer:
Verified
Related Questions
Q42: Drawing from a regular deck of playing
Q43: It costs $2.75 to play a dice
Q44: The table below shows the breakdown of
Q45: A bag contains 10 colored beads. A
Q46: Beatrice has a 2.60 GPA after completing
Q48: Eight health maintenance organizations (HMOs) presented group
Q49: How can <img src="https://d2lvgg3v3hfg70.cloudfront.net/TBX9048/.jpg" alt="How can
Q50: Each of the letters of the word
Q51: Below are the annual salaries (in thousands
Q52: The line graph below shows the average