Multiple Choice
The line graph below shows the average monthly snowfall during ski season around Aspen, Colorado. During which month is the snowfall the greatest ? 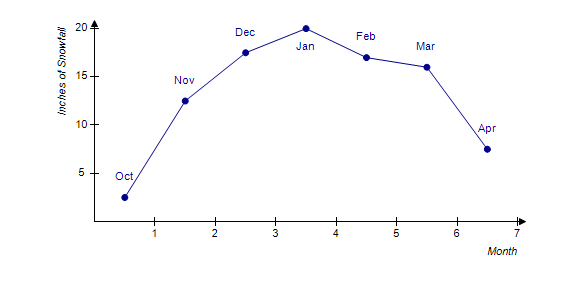
A) November
B) October
C) April
D) January
E) February
Correct Answer:

Verified
Correct Answer:
Verified
Related Questions
Q45: A bag contains 10 colored beads. A
Q46: Beatrice has a 2.60 GPA after completing
Q47: The table below shows the immigration rates
Q48: Eight health maintenance organizations (HMOs) presented group
Q49: How can <img src="https://d2lvgg3v3hfg70.cloudfront.net/TBX9048/.jpg" alt="How can
Q50: Each of the letters of the word
Q51: Below are the annual salaries (in thousands
Q53: Suppose the American Lung Association states that
Q54: Suppose the distribution of heights of a
Q55: The following table shows the population of