Multiple Choice
Which of these graphs could represent the graph of  ?
?
A) 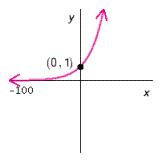
B) 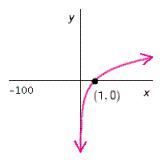
C) 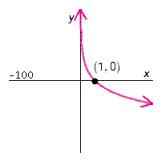
D) 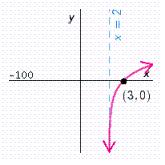
E) 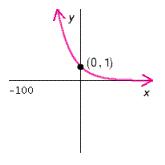
Correct Answer:

Verified
Correct Answer:
Verified
Related Questions
Q59: Use a calculator to find each common
Q60: Find the dB gain of an amplifier
Q61: Calculate how many times more intense an
Q62: Assume that <img src="https://d2lvgg3v3hfg70.cloudfront.net/TBX8967/.jpg" alt="Assume that
Q63: Use the properties of logarithms to write
Q65: The radioactive material Iodine-131 decays according to
Q66: Which of the following could represent the
Q67: Graph the exponential function. <img src="https://d2lvgg3v3hfg70.cloudfront.net/TBX8967/.jpg" alt="Graph
Q68: Assuming a Malthusian growth model and annual
Q69: Suppose that Nora invested $900 at 9.25%