menu-iconExamlexExamLexServices

Discover

Ask a Question
  1. All Topics
  2. Topic
    Mathematics
  3. Study Set
    Intermediate Algebra A Guided Approach
  4. Exam
    Exam 9: Exponential and Logarithmic Functions
  5. Question
    Which of the Following Could Represent the Graph of Y
Solved

Which of the Following Could Represent the Graph of Y

Question 66

Question 66

Multiple Choice

Which of the following could represent the graph of y = 0.5ln x + 1?


A) Which of the following could represent the graph of y = 0.5ln x + 1? A)    B)    C)    D)
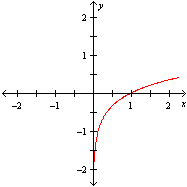
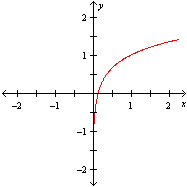
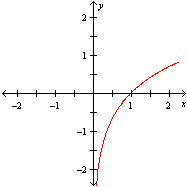
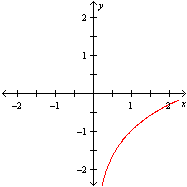
B) Which of the following could represent the graph of y = 0.5ln x + 1? A)    B)    C)    D)
C) Which of the following could represent the graph of y = 0.5ln x + 1? A)    B)    C)    D)
D) Which of the following could represent the graph of y = 0.5ln x + 1? A)    B)    C)    D)

Correct Answer:

verifed

Verified

Unlock this answer now
Get Access to more Verified Answers free of charge

Related Questions

Q61: Calculate how many times more intense an

Q62: Assume that <img src="https://d2lvgg3v3hfg70.cloudfront.net/TBX8967/.jpg" alt="Assume that

Q63: Use the properties of logarithms to write

Q64: Which of these graphs could represent the

Q65: The radioactive material Iodine-131 decays according to

Q67: Graph the exponential function. <img src="https://d2lvgg3v3hfg70.cloudfront.net/TBX8967/.jpg" alt="Graph

Q68: Assuming a Malthusian growth model and annual

Q69: Suppose that Nora invested $900 at 9.25%

Q70: Solve the logarithmic equation. Check the solution.

Q71: Write the logarithmic expression as one logarithm.

Examlex

ExamLex

About UsContact UsPerks CenterHomeschoolingTest Prep

Work With Us

Campus RepresentativeInfluencers

Links

FaqPricingChrome Extension

Download The App

Get App StoreGet Google Play

Policies

Privacy PolicyTerms of ServiceHonor CodeCommunity Guidelines

Scan To Download

qr-code

Copyright © (2025) ExamLex LLC.

Privacy PolicyTerms Of ServiceHonor CodeCommunity Guidelines