Multiple Choice
The gross profits for January at Tower Center for the five departments were: Appliance Department, $20,000 Automotive Department, $10,000 Clothing Department, $55,000 Grocery Department, $261,000 Nursery Department, $14,000 Use this information to determine the percentage of the gross profit in each region of the circle graph below. 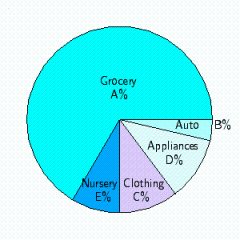
A) A = 2.8%, B = 2.8%, C = 15.3%, D = 72.5%, E = 3.9%
B) A = 94.4%, B = 97.2%, C = 84.7%, D = 27.5%, E = 96.1%
C) A = 5.6%, B = 2.8%, C = 72.5%, D = 15.3%, E = 3.9%
D) A = 72.5%, B = 2.8%, C = 15.3%, D = 5.6%, E = 3.9%
E) A = 5.6%, B = 72.5%, C = 15.3%, D = 2.8%, E = 3.9%
Correct Answer:

Verified
Correct Answer:
Verified
Q15: FIGURE 1. <img src="https://d2lvgg3v3hfg70.cloudfront.net/TBX9050/.jpg" alt="FIGURE 1.
Q16: The wages of employees of a
Q17: The purchasing power of the dollar (1967
Q18: The gross profits for January at Tower
Q19: The heights of 20 students are as
Q21: The following line graph shows the expenses
Q22: The graph below shows percentages of children
Q23: According to the Specialty Coffee Association,
Q24: The following line graph shows the expenses
Q25: 10,000 respondents were asked the following question.