Short Answer
10,000 respondents were asked the following question. If the election for U.S. Senate were being held today, for whom would you vote? Use the bar graph below to answer the questions that follow. 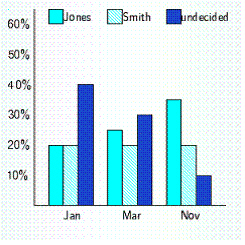 How many candidates were running for office? __________ Who was the favorite in the election poll? __________
Correct Answer:

Verified
Correct Answer:
Verified
Q20: The gross profits for January at Tower
Q21: The following line graph shows the expenses
Q22: The graph below shows percentages of children
Q23: According to the Specialty Coffee Association,
Q24: The following line graph shows the expenses
Q26: The graph below shows percentages of children
Q27: The graph below shows percentages of children
Q28: The amount of electricity used in a
Q29: The following line graph shows the expenses
Q30: The gross profits for January at Tower