Short Answer
The following line graph shows the expenses for two salespeople of the Leadwell Pencil Company. 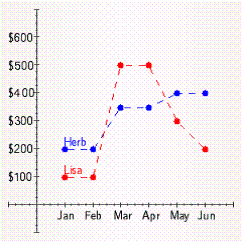 Which salesperson has more variability in his or her expenses?
Correct Answer:

Verified
Correct Answer:
Verified
Related Questions
Q24: The following line graph shows the expenses
Q25: 10,000 respondents were asked the following question.
Q26: The graph below shows percentages of children
Q27: The graph below shows percentages of children
Q28: The amount of electricity used in a
Q30: The gross profits for January at Tower
Q31: 10,000 respondents were asked the following question.
Q32: The wages of employees of a
Q33: The gross profits for January at Tower
Q34: The graph below shows percentages of children