Multiple Choice
The following chart plots the cumulative number of defects opened against the cumulative number of defects closed during system testing of a software product. 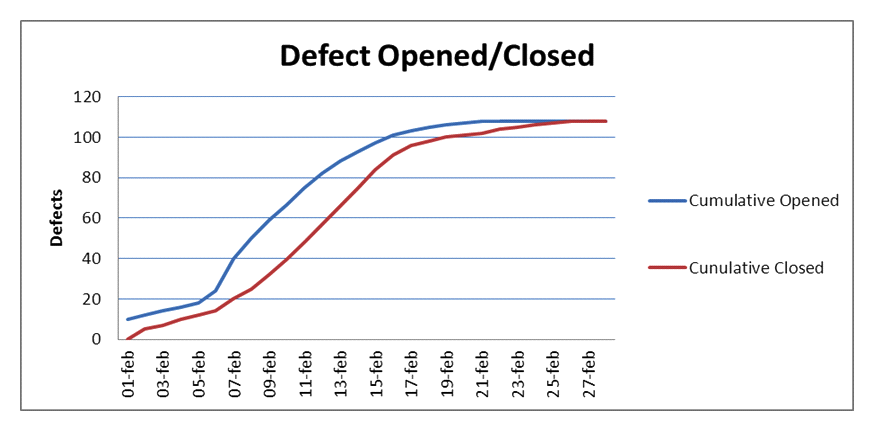 Which of the following statements is true? Number of correct responses: 1
A) The chart indicates that you have plenty of problems left to find
B) The chart can be used to reveal test progress problems
C) The chart seems to indicate that the defect management process is not working well
D) The chart seems to indicate that the defect management process is working well
Correct Answer:

Verified
Correct Answer:
Verified
Q1: The main objectives the senior management team
Q2: Assume you are the Test Manager for
Q4: You are the Test Manager of a
Q5: Consider the following test strategies:<br>A) Consultative test
Q6: Assume you are managing the system testing
Q7: Which of the following statements describing the
Q8: After a selection process you have selected
Q9: Which of the following statements best describes
Q10: You are following a risk-based testing strategy.
Q11: Which of the following is an example