Multiple Choice
After the presentation, you are asked to explain the chart. Assume you have applied a full risk-based testing strategy. 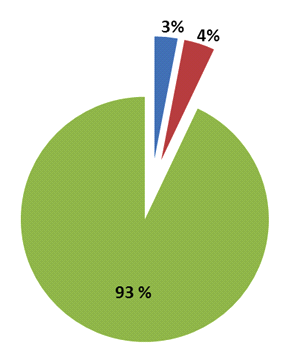 Which of the following answers would you expect to best describe the pie chart? Number of correct responses: 1
A) All the risk items have been covered with tests. No more risk items remain to test
B) According to the full risk-based testing strategy applied, it is very likely that the highest-risk items, tests and bugs remain in the blue and red areas. Therefore, it is very risky to release the application
C) Only the lowest-risk items, tests and bugs should remain in the blue and red areas. Therefore the application can be released at any time subject to management of the items identified in those areas
D) 97 percent of the risk items has been tested. No open bugs or test failures remain. Only 3 percent of risk items remains to be covered by the remaining test
Correct Answer:

Verified
Correct Answer:
Verified
Q19: The following are the exit criteria described
Q20: Assume you are currently working on a
Q21: Consider a defect report and assume that
Q22: Which of the following statements describing how
Q23: Which of the following statements about the
Q25: Assume you are a Test Manager involved
Q26: Which of the following statements describing the
Q27: Which of the following would you expect
Q28: You are the Test Manager on a
Q29: You are not confident with the assessment