Multiple Choice
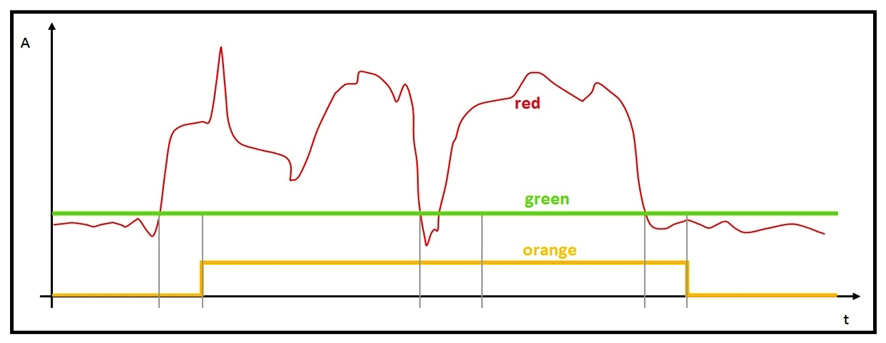 Refer to the exhibit. The graph has been provided by the monitoring team to the IoT Engineer. The red line represents the consumption of energy from an industrial machine. Which two pieces of information can be captured? (Choose two.)
A) The green graph visualizes the mean value of the data points.
B) The green graph visualizes if the electronic device is not in stand-by mode.
C) The orange graph visualizes a boolean: power on/off.
D) The orange graph contains more information than the red graph.
Correct Answer:

Verified
Correct Answer:
Verified
Q31: A customer is deploying sensors with Cisco
Q32: Which command is used to package a
Q33: Which element ensures that PKI is used
Q34: When an RS232 device is connected to
Q35: <img src="https://d2lvgg3v3hfg70.cloudfront.net/C1178/.jpg" alt=" Refer to the
Q36: <img src="https://d2lvgg3v3hfg70.cloudfront.net/C1178/.jpg" alt=" Refer to the
Q37: <img src="https://d2lvgg3v3hfg70.cloudfront.net/C1178/.jpg" alt=" Refer to the
Q38: An IoT application has been built into
Q39: <img src="https://d2lvgg3v3hfg70.cloudfront.net/C1178/.jpg" alt=" Refer to the
Q40: Mosquitto was installed correctly on the Cisco