Short Answer
Figure 2-13
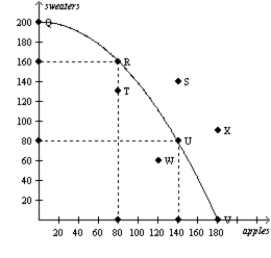 Consider the production possibilities curve for a country that can produce sweaters, apples (in bushels), or a combination of the two.
-Refer to Figure 2-13. What is the opportunity cost of moving from point R to point Q?
Correct Answer:

Verified
80 bushels...View Answer
Unlock this answer now
Get Access to more Verified Answers free of charge
Correct Answer:
Verified
View Answer
Unlock this answer now
Get Access to more Verified Answers free of charge
Q251: The prairie dog has always been considered
Q252: Figure 2-10<br><br> <img src="https://d2lvgg3v3hfg70.cloudfront.net/TB7555/.jpg" alt="Figure 2-10
Q253: Figure 2-12<br><br> <img src="https://d2lvgg3v3hfg70.cloudfront.net/TB7555/.jpg" alt="Figure 2-12
Q254: Figure 2-9<br><br>Commuter Rail Passengers by Frequency of
Q255: When two variables move in the same
Q257: If an economy can produce more of
Q258: In the circular-flow diagram, households and firms
Q259: Positive statements can be evaluated using data
Q260: Economists make assumptions to<br>A)minimize the number of
Q261: In the circular-flow diagram, one loop represents