Multiple Choice
Figure 2-9
Commuter Rail Passengers by Frequency of Service
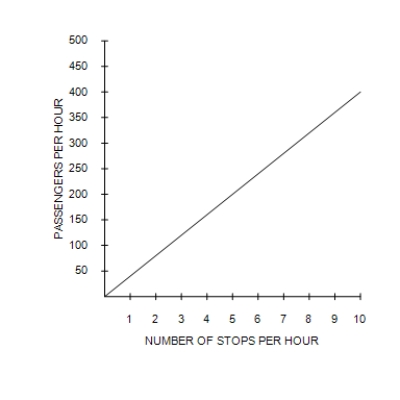
-Refer to Figure 2-9. Which of the following conclusions should not be drawn from observing this graph?
A) There is a positive correlation between the frequency of service and the number of passengers.
B) When there are five stops per hour, there are approximately 200 passengers.
C) More stops per hour is associated with more passengers per hour.
D) No other factors besides the frequency of service affect the number of passengers.
Correct Answer:

Verified
Correct Answer:
Verified
Q249: When two variables have a negative correlation,<br>A)if
Q250: Figure 2-10<br><br> <img src="https://d2lvgg3v3hfg70.cloudfront.net/TB7555/.jpg" alt="Figure 2-10
Q251: The prairie dog has always been considered
Q252: Figure 2-10<br><br> <img src="https://d2lvgg3v3hfg70.cloudfront.net/TB7555/.jpg" alt="Figure 2-10
Q253: Figure 2-12<br><br> <img src="https://d2lvgg3v3hfg70.cloudfront.net/TB7555/.jpg" alt="Figure 2-12
Q255: When two variables move in the same
Q256: Figure 2-13<br><br> <img src="https://d2lvgg3v3hfg70.cloudfront.net/TB7555/.jpg" alt="Figure 2-13
Q257: If an economy can produce more of
Q258: In the circular-flow diagram, households and firms
Q259: Positive statements can be evaluated using data