Multiple Choice
Refer to the figure.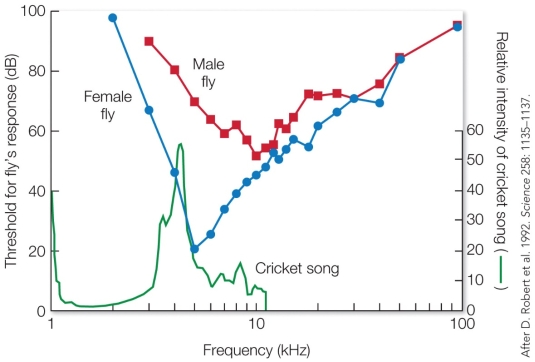 If the data collected for the graph were not gathered simply to describe the hearing abilities of the fly, then (for the biologists who did the research) the graph constitutes a
A) hypothesis on why the fly species has been able to survive to the present.
B) test of a prediction on fly hearing ability, based on the kind of sound frequencies produced by crickets.
C) check on the prediction that crickets should have evolved the ability to avoid their fly parasites.
D) test of the hypothesis that fly hearing abilities are designed to help the species maintain a stable or growing population.
Correct Answer:

Verified
Correct Answer:
Verified
Q1: A simple network of three clusters of
Q3: Refer to the figure.<br><img src="https://d2lvgg3v3hfg70.cloudfront.net/TBO1022/.jpg" alt="Refer to
Q4: Mike May studied the relationship between cricket
Q5: Mike May studied the relationship between cricket
Q6: Tinbergen found that when young herring gull
Q7: Why is the change in sensitivity of
Q8: Refer to the figure.<br><img src="https://d2lvgg3v3hfg70.cloudfront.net/TBO1022/.jpg" alt="Refer to
Q9: The brain's somatosensory cortex does not consist
Q10: Refer to the figure.<br><img src="https://d2lvgg3v3hfg70.cloudfront.net/TBO1022/.jpg" alt="Refer to
Q11: Refer to the figure.<br><img src="https://d2lvgg3v3hfg70.cloudfront.net/TBO1022/.jpg" alt="Refer to