Multiple Choice
Refer to the figure.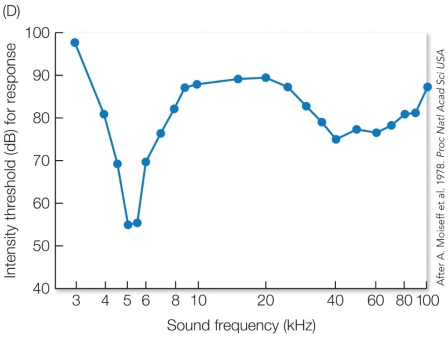 Based on the information in the graph, what would you predict is the sound frequency (kHz) of ultrasonic bat calls?
A) 3-kHz, because the intensity threshold is at its highest point and it is a low-frequency.
B) 5-kHz, because the intensity threshold is at its lowest point and it is a low-frequency.
C) 40-kHz, because there is a dip in the intensity threshold and it is a high-frequency.
D) 100-kHz, because the intensity threshold is high, and it is the highest frequency recorded.
Correct Answer:

Verified
Correct Answer:
Verified
Q1: A simple network of three clusters of
Q2: Refer to the figure.<br><img src="https://d2lvgg3v3hfg70.cloudfront.net/TBO1022/.jpg" alt="Refer to
Q4: Mike May studied the relationship between cricket
Q5: Mike May studied the relationship between cricket
Q6: Tinbergen found that when young herring gull
Q7: Why is the change in sensitivity of
Q8: Refer to the figure.<br><img src="https://d2lvgg3v3hfg70.cloudfront.net/TBO1022/.jpg" alt="Refer to
Q9: The brain's somatosensory cortex does not consist
Q10: Refer to the figure.<br><img src="https://d2lvgg3v3hfg70.cloudfront.net/TBO1022/.jpg" alt="Refer to
Q11: Refer to the figure.<br><img src="https://d2lvgg3v3hfg70.cloudfront.net/TBO1022/.jpg" alt="Refer to