Multiple Choice
Refer to the figure shown.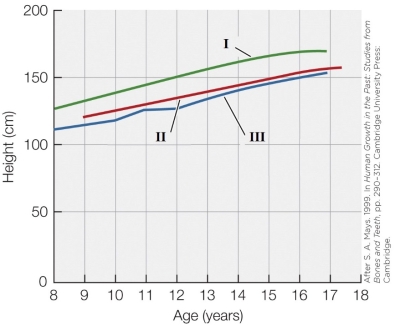 Which of the following populations in the figure are from the twentieth century?
A) Population I
B) Population II
C) Population III
D) Populations I and II
Correct Answer:

Verified
Correct Answer:
Verified
Q38: Refer to the figure shown.<br><img src="https://d2lvgg3v3hfg70.cloudfront.net/TBO1030/.jpg" alt="Refer
Q39: Refer to the figure shown.<br><img src="https://d2lvgg3v3hfg70.cloudfront.net/TBO1030/.jpg" alt="Refer
Q40: Refer to the table shown.<br><img src="https://d2lvgg3v3hfg70.cloudfront.net/TBO1030/.jpg" alt="Refer
Q41: In terms of homeothermy, newborn mammals _
Q42: Refer to the figure shown.<br><img src="https://d2lvgg3v3hfg70.cloudfront.net/TBO1030/.jpg" alt="Refer
Q44: Refer to the figure shown.<br><img src="https://d2lvgg3v3hfg70.cloudfront.net/TBO1030/.jpg" alt="Refer
Q45: If DNA methylation is blocked early in
Q46: Refer to the figure shown.<br><img src="https://d2lvgg3v3hfg70.cloudfront.net/TBO1030/.jpg" alt="Refer
Q47: Refer to the graphs shown.<br><img src="https://d2lvgg3v3hfg70.cloudfront.net/TBO1030/.jpg" alt="Refer
Q48: We know the environment can have significant