Multiple Choice
Refer to the figure shown.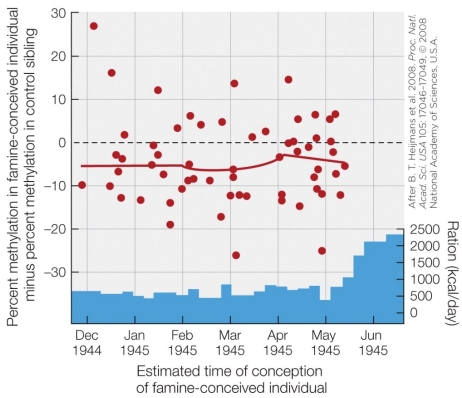 The data in the figure show that DNA methylation
A) correlates with caloric intake.
B) does not change during a famine.
C) of individuals conceived during a famine was lower than that of siblings conceived during no famine.
D) of individuals conceived during a famine was higher than that of siblings conceived during no famine.
Correct Answer:

Verified
Correct Answer:
Verified
Q34: The phenomenon in which genetically identical individuals
Q35: Refer to the figure shown.<br><img src="https://d2lvgg3v3hfg70.cloudfront.net/TBO1030/.jpg" alt="Refer
Q36: As hooded seals develop from weanlings, the
Q37: Refer to the graphs shown.<br><img src="https://d2lvgg3v3hfg70.cloudfront.net/TBO1030/.jpg" alt="Refer
Q38: Refer to the figure shown.<br><img src="https://d2lvgg3v3hfg70.cloudfront.net/TBO1030/.jpg" alt="Refer
Q40: Refer to the table shown.<br><img src="https://d2lvgg3v3hfg70.cloudfront.net/TBO1030/.jpg" alt="Refer
Q41: In terms of homeothermy, newborn mammals _
Q42: Refer to the figure shown.<br><img src="https://d2lvgg3v3hfg70.cloudfront.net/TBO1030/.jpg" alt="Refer
Q43: Refer to the figure shown.<br><img src="https://d2lvgg3v3hfg70.cloudfront.net/TBO1030/.jpg" alt="Refer
Q44: Refer to the figure shown.<br><img src="https://d2lvgg3v3hfg70.cloudfront.net/TBO1030/.jpg" alt="Refer