Not Answered
The following tables show the relationship, for employed respondents, between hours per week the respondent usually works (Work hours), level of education (number of years completed), and sex for the 2016 GSS.
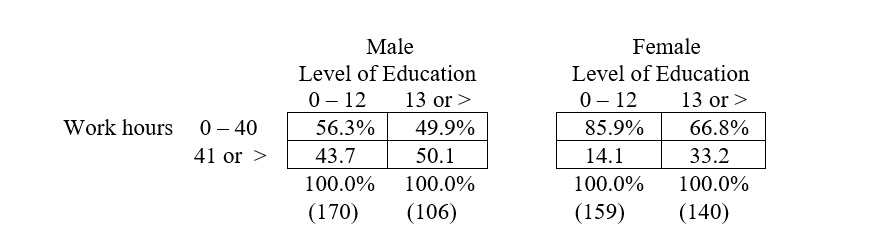 a. Which variable is controlled in each partial table?
b. Describe the relationship in each partial table.
c. The first partial (for males) has a chi-square value of 1.07, with p > .10; the second table (for females) has a chi-square value of 15.5, with p < .001. What do these statistics reveal about the relationships between the variables?
d. The zero-order association between level of education and usual hours worked per week was statistically significant. Comparing this result with the results of the partial tables, what type of elaboration outcome is shown?
Correct Answer:

Verified
Correct Answer:
Verified
Q42: Path analysis provides quantitative estimates of both
Q43: A multivariate cross-tabulation with one control variable
Q44: A dummy variable in a multiple regression
Q45: Which of the following statements is not
Q46: In nonexperimental research, as in experiments, it
Q47: R<sup>2</sup> is a popular measure of how
Q48: Table 1<br> <img src="https://d2lvgg3v3hfg70.cloudfront.net/TBO1037/.jpg" alt="Table 1
Q49: The presence of a _ variable makes
Q50: A partial-regression coefficient in a multiple regression
Q51: Explain the difference between the regression coefficient