Essay
Refer to the tables.
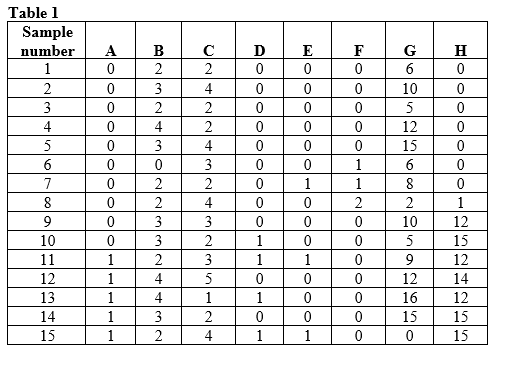
 Suppose you are researching an ecological community in a new study area. You divide your study area into quadrats and sample one quadrat a day to determine the species that occupy the area and how many individuals of these species are present. Assume that by the end of your sampling efforts, you have identified all of the species that occur in the study area. Now suppose that species H is an invasive species and that the samples listed in Table 1 show the presence and abundance of species in the same area across 15 years of study. Examine the patterns and impact of the invasion of species H on this community by answering the following questions:
a) Based on Table 1, in which year did species H invade the community?
b) Based on Table 1, when did populations of species H begin to grow?
c) By the end of your study period (in year 15), how does the proportional abundance of species H compare to that of other species in the community?
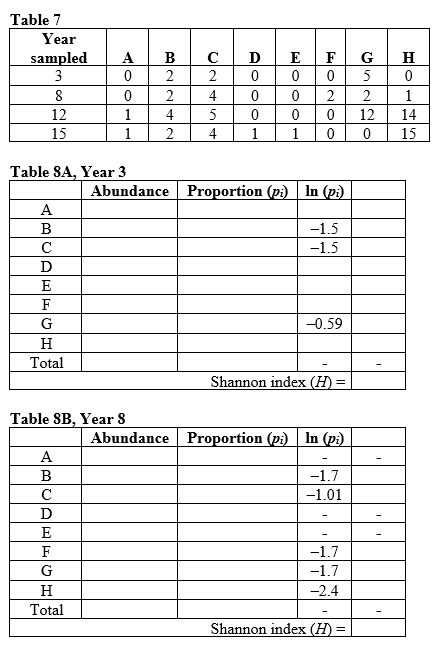
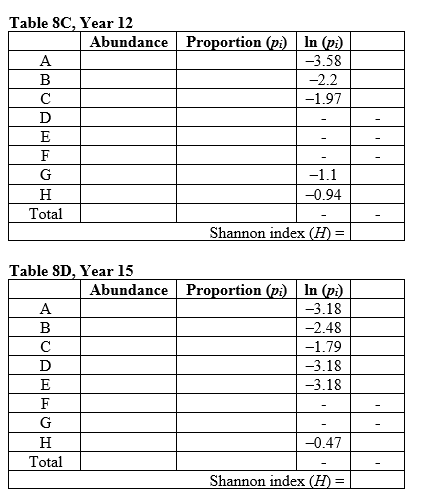
d) Calculate species richness and diversity for years 3, 8, 12, and 15 based on the data in Table 7. Calculate the Shannon index of species diversity, using Table 8 (supplied) to enter your data to create a new table (these will be referred to as Table 8A, Year 3; 8B, Year 8; 8C Year 12; and 8D, Year 15).
Correct Answer:

Verified
a) Species H invaded the commu...View Answer
Unlock this answer now
Get Access to more Verified Answers free of charge
Correct Answer:
Verified
View Answer
Unlock this answer now
Get Access to more Verified Answers free of charge
Q1: Which statement about foundation species is true?<br>A)
Q2: Refer to the figure.<br><img src="https://d2lvgg3v3hfg70.cloudfront.net/TBO1115/.jpg" alt="Refer to
Q3: Refer to the table and the figure.<br>Table
Q4: Refer to the table and figure.<br> <img
Q5: Refer to the figure.<br><img src="https://d2lvgg3v3hfg70.cloudfront.net/TBO1115/.jpg" alt="Refer to
Q7: Refer to the figure.<br><img src="https://d2lvgg3v3hfg70.cloudfront.net/TBO1115/.jpg" alt="Refer to
Q8: Which conclusion was the primary finding of
Q9: How many total trophic levels are present
Q10: Which statement best describes the difference between
Q11: Refer to the table.<br>Table 9<br> <img src="https://d2lvgg3v3hfg70.cloudfront.net/TBO1115/.jpg"