Essay
Refer to the table.
Table 9
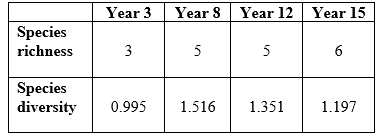 Suppose you are researching an ecological community in a new study area. You divide your study area into quadrats and sample one quadrat a day to determine the species that occupy the area and how many individuals of these species are present. Assume that by the end of your sampling efforts, you have identified all of the species that occur in the study area. Use the data in Table 9 to answer the following questions:
a) Create a graph (this will be referred to as Figure 4) of species richness and species diversity over the study years.
b) When was species richness lowest, and when was it highest? When was species diversity lowest, and when was it highest?
c) What is the effect of invasive species H on community structure in year 3 compared to year 8?
d) What is the overall impact of invasive species H on the species richness and species diversity of this community?
Correct Answer:

Verified
a)
Figure 4
 b) Species richness was lo...
View Answer
Unlock this answer now
Get Access to more Verified Answers free of charge
Correct Answer:
Verified
Figure 4
View Answer
Unlock this answer now
Get Access to more Verified Answers free of charge
Q6: Refer to the tables.<br> <img src="https://d2lvgg3v3hfg70.cloudfront.net/TBO1115/.jpg" alt="Refer
Q7: Refer to the figure.<br><img src="https://d2lvgg3v3hfg70.cloudfront.net/TBO1115/.jpg" alt="Refer to
Q8: Which conclusion was the primary finding of
Q9: How many total trophic levels are present
Q10: Which statement best describes the difference between
Q12: Refer to the tables and figure.<br> <img
Q13: Refer to the figure.<br><img src="https://d2lvgg3v3hfg70.cloudfront.net/TBO1115/.jpg" alt="Refer to
Q14: Menge and colleagues performed experiments in which
Q15: Alsterberg and colleagues showed that with ocean
Q16: Refer to the figure.<br><img src="https://d2lvgg3v3hfg70.cloudfront.net/TBO1115/.jpg" alt="Refer to