Multiple Choice
Refer to the figure.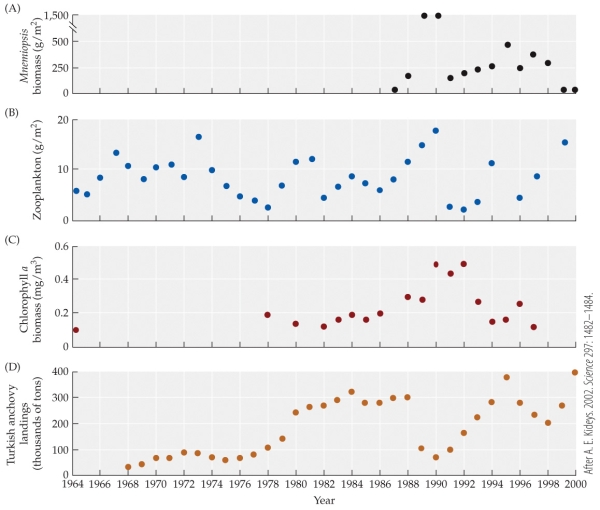
- Based on the figure, which of the following most likely explains the rapid increase in zooplankton between 1996 and 1999?
A) Rapid decrease in chlorophyll a
B) Rapid increase in anchovies
C) Rapid decrease in Mnemiopsis
D) Rapid increase in Mnemiopsis
Correct Answer:

Verified
Correct Answer:
Verified
Q35: Imagine a moose in Grand Teton National
Q36: Which of the following statements is a
Q37: Which of the following provides a clear
Q38: Which statement about the Black Sea is
Q39: Which statement about the effects of the
Q41: Refer to the figure.<br><img src="https://d2lvgg3v3hfg70.cloudfront.net/TBO1115/.jpg" alt="Refer to
Q42: Which statement about environmental stochasticity is true?<br>A)
Q43: In the 1950s, Nicholson's experiments with blowflies
Q44: Refer to the figure.<br><img src="https://d2lvgg3v3hfg70.cloudfront.net/TBO1115/.jpg" alt="Refer to
Q45: Nicholson (1957) found that when adult sheep