Multiple Choice
Refer to the figure.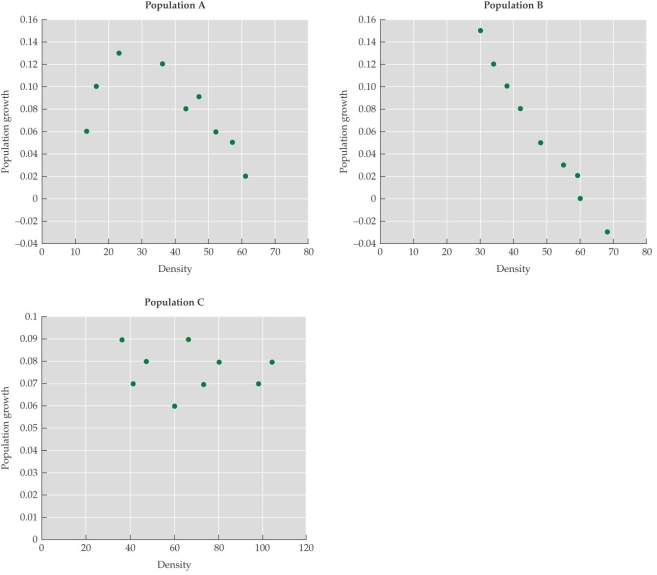 The figure is derived from studies of the populations and per-individual growth rates of three species of rodents in the U.S. desert southwest. According to the figure, which population(s) show(s) evidence of Allee effects?
A) Population A only
B) Population B only
C) Population C only
D) Populations A and B
Correct Answer:

Verified
Correct Answer:
Verified
Q39: Which statement about the effects of the
Q40: Refer to the figure.<br><img src="https://d2lvgg3v3hfg70.cloudfront.net/TBO1115/.jpg" alt="Refer to
Q41: Refer to the figure.<br><img src="https://d2lvgg3v3hfg70.cloudfront.net/TBO1115/.jpg" alt="Refer to
Q42: Which statement about environmental stochasticity is true?<br>A)
Q43: In the 1950s, Nicholson's experiments with blowflies
Q45: Nicholson (1957) found that when adult sheep
Q46: Refer to the figure.<br><img src="https://d2lvgg3v3hfg70.cloudfront.net/TBO1115/.jpg" alt="Refer to
Q47: Refer to the figure.<br><img src="https://d2lvgg3v3hfg70.cloudfront.net/TBO1115/.jpg" alt="Refer to
Q48: Consider a population of birds that land
Q49: Which pattern of population dynamics best describes