Multiple Choice
Refer to the figure showing the results of Bjorkman and colleagues' studies of plant responses to different light levels. The plants were reared at three different levels of light intensity: high (red line) , medium (blue line) , and low (green line) . The acclimatized plants were then subjected to various light levels, and their ability to photosynthesize was measured.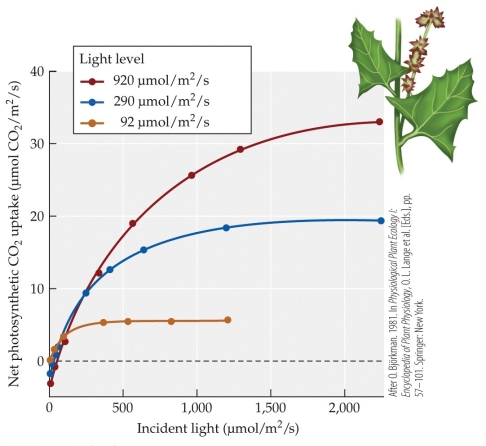
-At approximately what light intensity level are the plants acclimatized to high-intensity light photosynthesizing at twice the rate of those plants acclimatized to low-intensity light?
A) 100 ?mol/m2/s
B) 300 ?mol/m2/s
C) 600 ?mol/m2/s
D) 1,000 ?mol/m2/s
Correct Answer:

Verified
Correct Answer:
Verified
Q41: Characteristics of an animal's digestive tract can
Q42: Organisms that can convert energy from sunlight
Q43: Lichens and other Arctic plants can carry
Q44: Refer to the figure showing delta values
Q45: Which hypothesis about the benefits of photorespiration
Q47: Suppose a crow normally uses 50 energy
Q48: An autotrophic organism living in a hydrothermal
Q49: Some species in the genus Clusia start
Q50: Orangutans are herbivorous primates. Two orangutans have
Q51: In the CAM pathway, in contrast to